Lots of interesting abstracts and cases were submitted for TCTAP 2026. Below are the accepted ones after a thorough review by our official reviewers. Don’t miss the opportunity to expand your knowledge!
ABS20251114_0009
Impact of Elevated Microcirculatory Resistance on the Relationship Between Resting Full-cycle Ratio and Fractional Flow Reserve
By Nao Yasuda, Takuma Tsuda
Presenter
Nao Yasuda
Authors
Nao Yasuda1, Takuma Tsuda1
Affiliation
Nagoya Ekisaikai Hospital, Japan1
View Study Report
ABS20251114_0009
FFR
Impact of Elevated Microcirculatory Resistance on the Relationship Between Resting Full-cycle Ratio and Fractional Flow Reserve
Nao Yasuda1, Takuma Tsuda1
Nagoya Ekisaikai Hospital, Japan1
Background
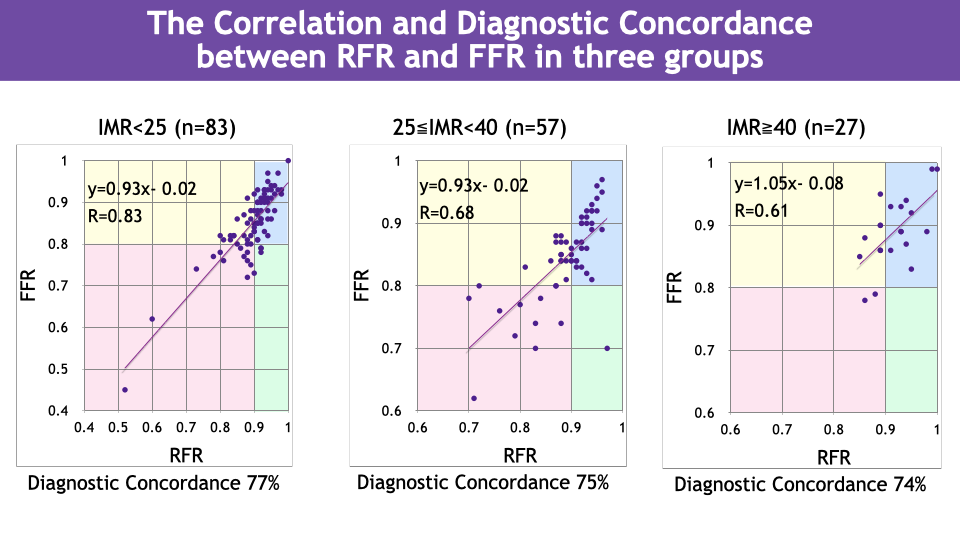
Resting full-cycle ratio (RFR) and fractional flow reserve (FFR) typically exhibit good correlation and are widely used for assessing functional myocardial ischemia. However, in some cases, evaluations by RFR and FFR diverge, and the presence of coronary microvascular dysfunction has been reported as a possible cause. At our institution, with the introduction of the CoroFlow system (Abbott, USA), measurement of the index of microcirculatory resistance (IMR) became feasible. Therefore, we conducted a clinical investigation of cases with RFR/FFR discordance using IMR.
Methods
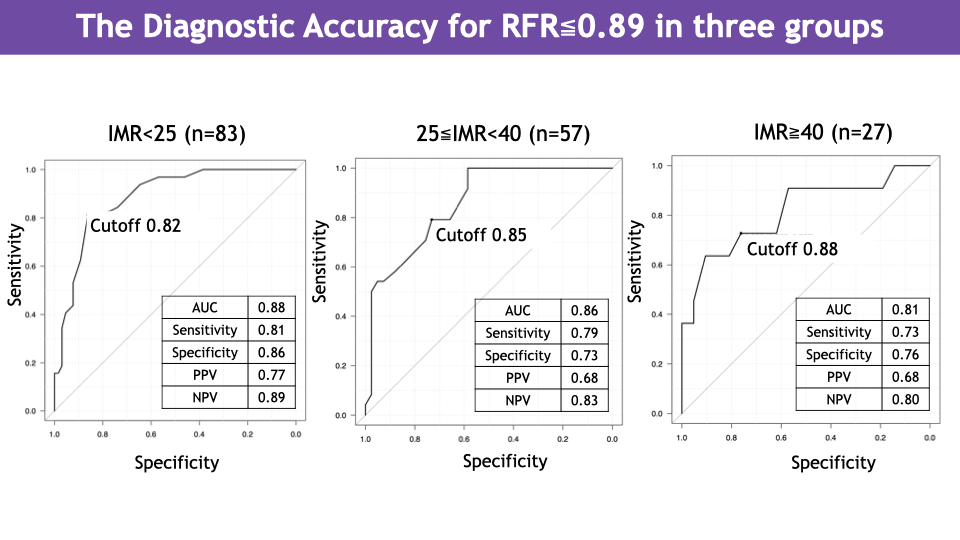
We analyzed 167 consecutive lesions in the left anterior descending artery for which RFR, FFR, and IMR were measured. The cases were divided into three groups according to IMR: high-IMR group (IMR ≥ 40), moderate-IMR group (25 ≤ IMR < 40), and normal-IMR group (IMR < 25). For each group, we calculated the correlation coefficient between RFR and FFR, the diagnostic concordance rate, and conducted receiver-operating characteristic (ROC) analysis to assess the diagnostic performance of FFR in predicting RFR ≤ 0.89, including determination of the optimal FFR cut-off value.
Results
In the high-IMR group, RFR and FFR showed a correlation coefficient of 0.61 and a diagnostic concordance rate of 74 %. In the moderate-IMR group, the correlation coefficient was 0.68 and the concordance rate was 75 %. In the normal-IMR group, the correlation coefficient was 0.83 and the concordance rate was 77 %. As IMR increased, the correlation between RFR and FFR weakened and the diagnostic concordance rate declined. In ROC analysis, the area under the curve (AUC) for the high-IMR group was 0.81 [95 % CI: 0.64 to 0.99], and the optimal FFR cut-off was 0.88. For the moderate-IMR group, AUC was 0.86 [95 % CI: 0.77 to 0.95] with cut-off 0.85. For the normal-IMR group, AUC was 0.88 [95 % CI: 0.82 to 0.95] with cut-off 0.82. With increasing IMR, diagnostic performance decreased and the optimal cut-off value increased.
Conclusion
In ischemia assessment, in cases with elevated IMR the threshold values for RFR and FFR may differ from those in cases with normal IMR. Consideration of coronary microvascular resistance is important when interpreting RFR/FFR discordance.