Lots of interesting abstracts and cases were submitted for TCTAP & AP VALVES 2020 Virtual. Below are accepted ones after thoroughly reviewed by our official reviewers. Don’t miss the opportunity to explore your knowledge and interact with authors as well as virtual participants by sharing your opinion!
* The E-Science Station is well-optimized for PC.
We highly recommend you use a desktop computer or laptop to browse E-posters.
ABS20191007_0002
| Acute Coronary Syndromes (STEMI, NSTE-ACS) | |||||||||||||||||||||||||||||||||||||||||||||||||||||||||||||||||||||||||||||||||||||||||||||||||||||||||||||||||||||||||||||||||||||||||||||||||||||||||||
| Long-Term Outcomes of Single-Vessel Percutaneous Coronary Intervention on Culprit Vessel Versus Multivessel Percutaneous Coronary Intervention in Non-ST-Segment Elevation Acute Coronary Syndrome Patients with Multivessel Coronary Artery Disease | |||||||||||||||||||||||||||||||||||||||||||||||||||||||||||||||||||||||||||||||||||||||||||||||||||||||||||||||||||||||||||||||||||||||||||||||||||||||||||
| Tianyu Li1, Sida Jia1, Yue Liu1, Yi Yao1, Ying Song1, Xiaofang Tang1, Xueyan Zhao1, Runlin Gao1, Yuejin Yang1, Bo Xu1, Zhan Gao1, Jinqing Yuan1 | |||||||||||||||||||||||||||||||||||||||||||||||||||||||||||||||||||||||||||||||||||||||||||||||||||||||||||||||||||||||||||||||||||||||||||||||||||||||||||
| Fuwai Hospital, China1 | |||||||||||||||||||||||||||||||||||||||||||||||||||||||||||||||||||||||||||||||||||||||||||||||||||||||||||||||||||||||||||||||||||||||||||||||||||||||||||
|
Background:
A lack of clarity exists regarding the optimal percutaneous coronary intervention (PCI) strategy in non-ST-segment elevation acute coronary syndrome (NSTE-ACS) patients with multivessel coronary artery disease (MV-CAD). We aimed to compare long-term prognosis between multivessel PCI (MV-PCI) and single-vessel PCI on culprit vessel (SV-PCI) in patients with MV-CAD presenting with NSTE-ACS.
|
|||||||||||||||||||||||||||||||||||||||||||||||||||||||||||||||||||||||||||||||||||||||||||||||||||||||||||||||||||||||||||||||||||||||||||||||||||||||||||
|
Methods:
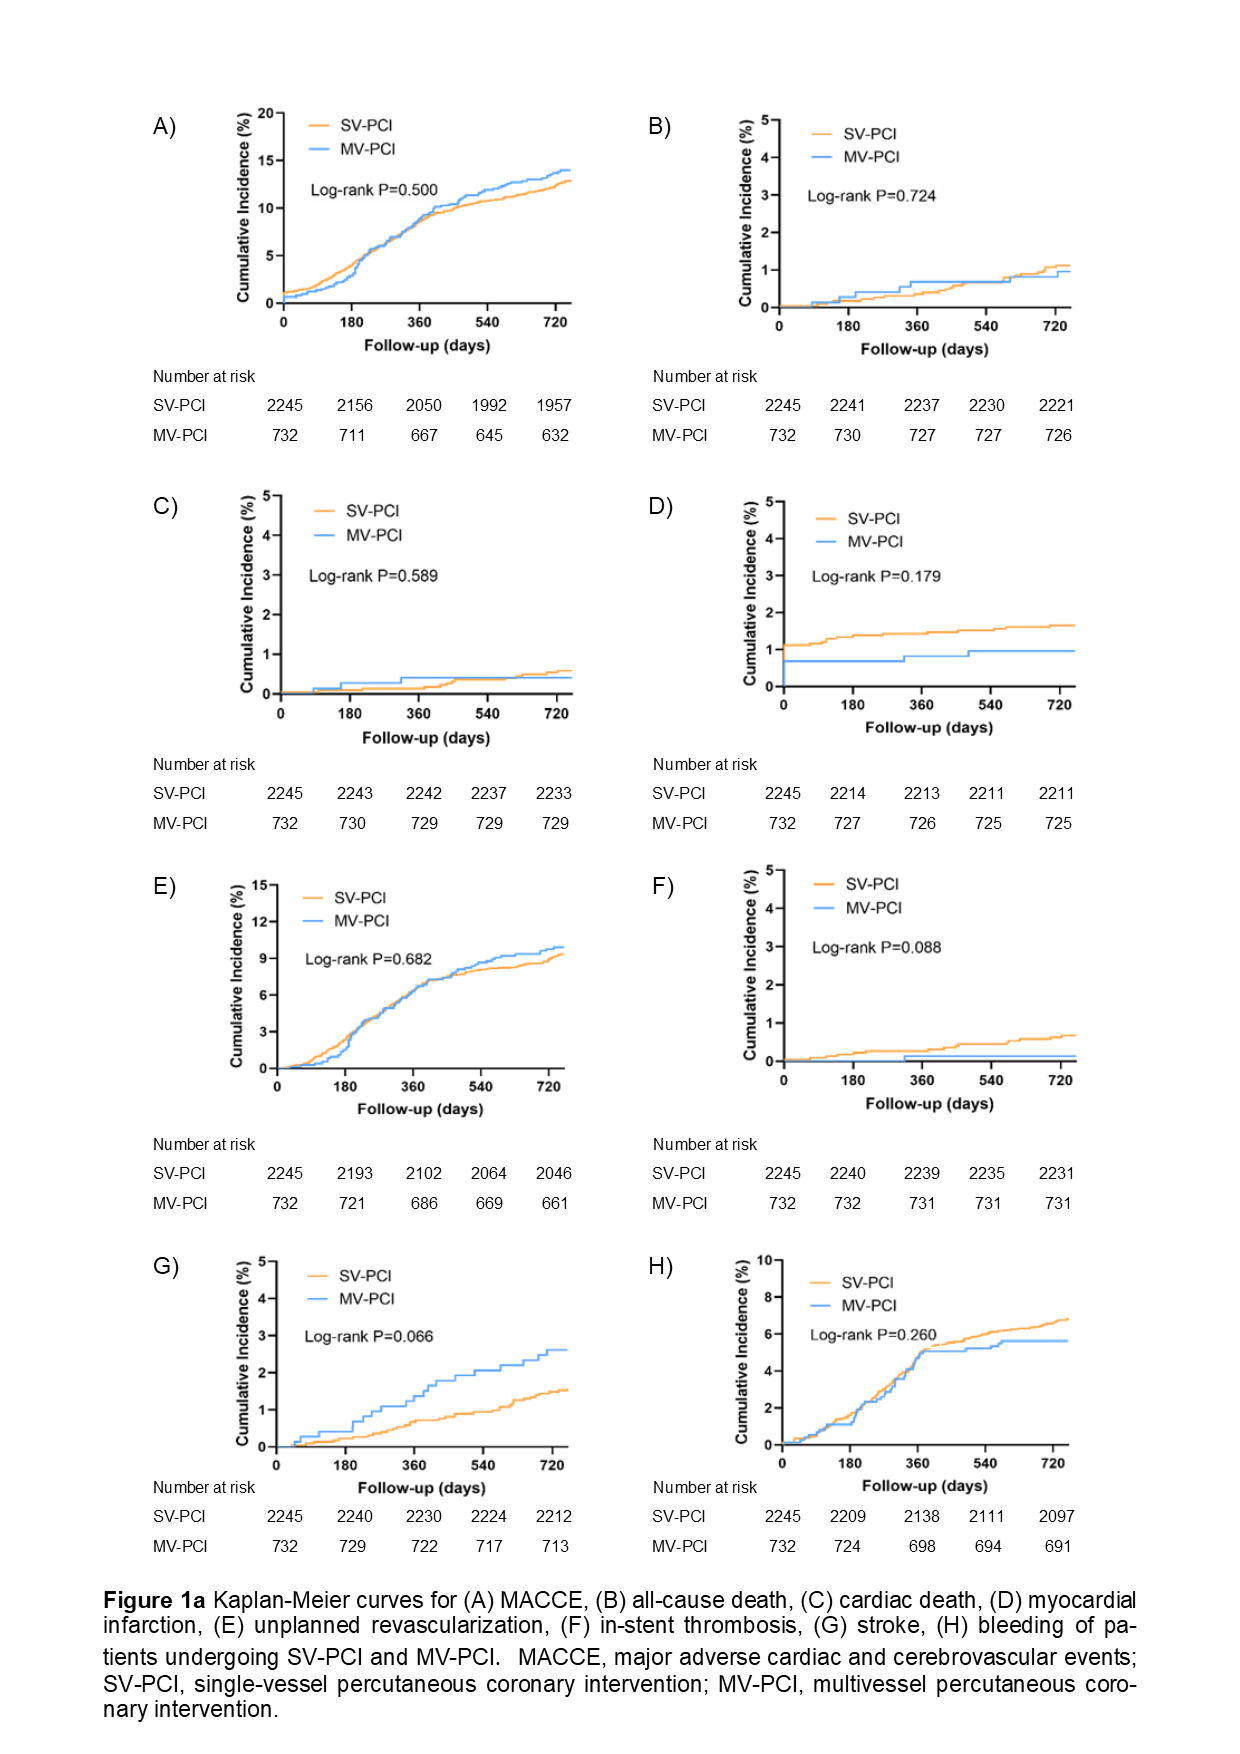
Patients with MV-CAD presenting with NSTE-ACS undergoing PCI in Fuwai Hospital in 2013 were prospectively enrolled. SV-PCI was defined as targeting only the culprit vessel, while MV-PCI was defined as treating ≥ 1 coronary artery(s) in addition to the culprit vessel at the index procedure. The primary endpoint was the incidence of major adverse cardiovascular and cerebrovascular events (MACCE), consisting of all-cause death, cardiac death, myocardial infarction, unplanned revascularization, or stroke at 2 years.
|
|||||||||||||||||||||||||||||||||||||||||||||||||||||||||||||||||||||||||||||||||||||||||||||||||||||||||||||||||||||||||||||||||||||||||||||||||||||||||||
|
Results:
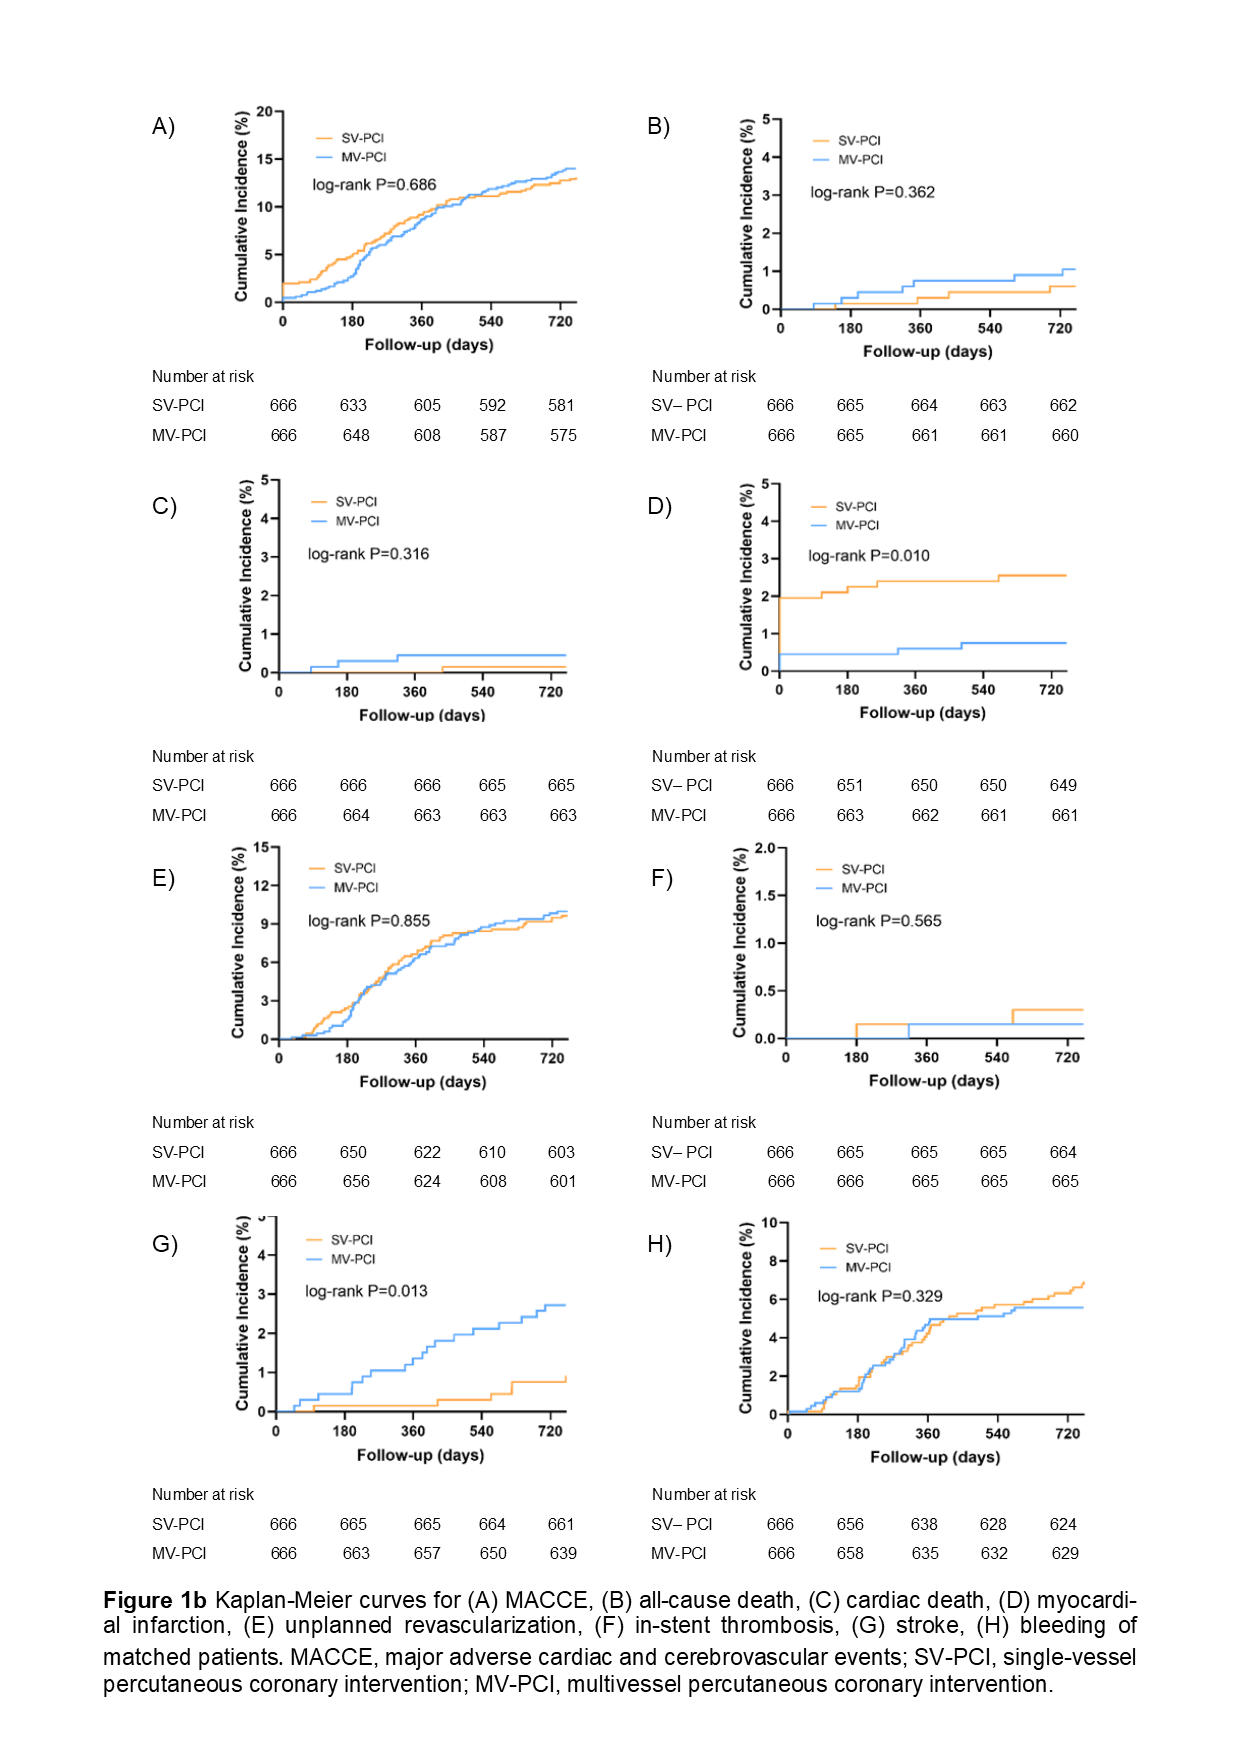
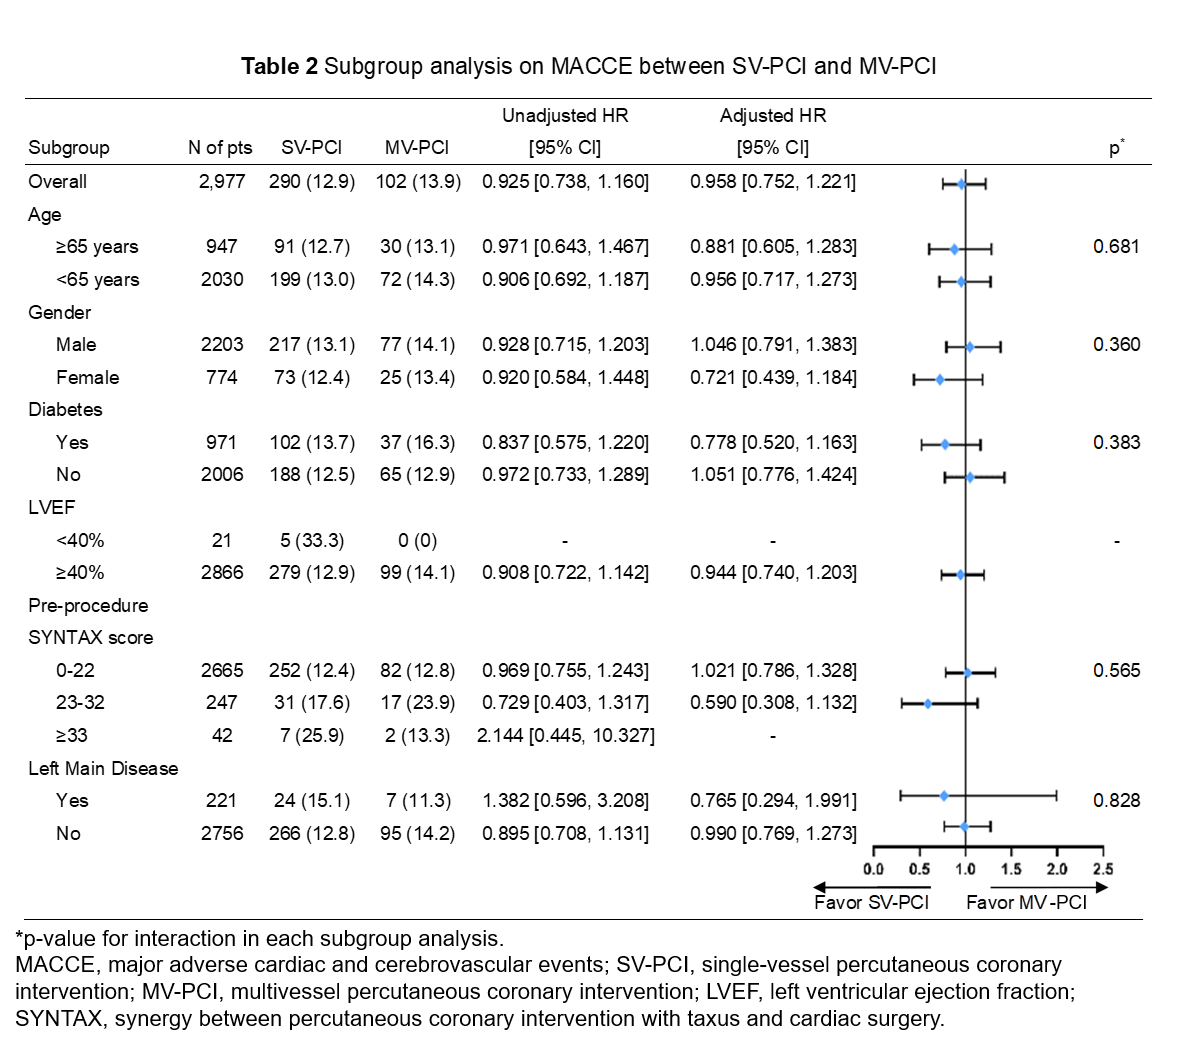
A total of 2,977 patients were included in our study. SV-PCI and MV-PCI were performed in 2,245 patients (75.4%) and 732 patients (24.6%), respectively. During a median follow-up of 2.1 years, the MACCE rates and adjusted risk were not significantly different between the SV-PCI and MV-PCI group (12.9% vs. 13.9%, p = 0.480; adjusted HR = 0.958, 95% CI: 0.752 - 1.221) . Similar results were observed in propensity-matched patients (13.1% vs. 14.0%, p = 0.631; adjusted HR = 0.945; 95% CI: 0.689 - 1.298). Subgroup analysis revealed a consistent effect on 2-year MACCE across different subgroups.
Table 1 Cox Regression analysis of SV-PCI/MV-PCI on 2-year clinical outcomes
   |
|||||||||||||||||||||||||||||||||||||||||||||||||||||||||||||||||||||||||||||||||||||||||||||||||||||||||||||||||||||||||||||||||||||||||||||||||||||||||||
|
Conclusion:
In NSTE-ACS patients with MV-CAD, MV-PCI is not superior to SV-PCI in terms of long-term MACCE. Further randomized control trials are required to guide practice.
|
|||||||||||||||||||||||||||||||||||||||||||||||||||||||||||||||||||||||||||||||||||||||||||||||||||||||||||||||||||||||||||||||||||||||||||||||||||||||||||