Lots of interesting abstracts and cases were submitted for TCTAP 2022. Below are the accepted ones after a thorough review by our official reviewers. Don’t miss the opportunity to expand your knowledge and interact with authors as well as virtual participants by sharing your opinion in the comment section!
TCTAP A-041
Prognostic Value of Fibrinogen-To-Albumin Ratio in Patients With Coronary Artery Disease and Diabetes Following Percutaneous Coronary Intervention
By Peizhi Wang, Deshan Yuan, Jinqing Yuan
Presenter
Peizhi Wang
Authors
Peizhi Wang1, Deshan Yuan1, Jinqing Yuan1
Affiliation
Fuwai Hospital, China1
View Study Report
TCTAP A-041
Diabetes
Prognostic Value of Fibrinogen-To-Albumin Ratio in Patients With Coronary Artery Disease and Diabetes Following Percutaneous Coronary Intervention
Peizhi Wang1, Deshan Yuan1, Jinqing Yuan1
Fuwai Hospital, China1
Background
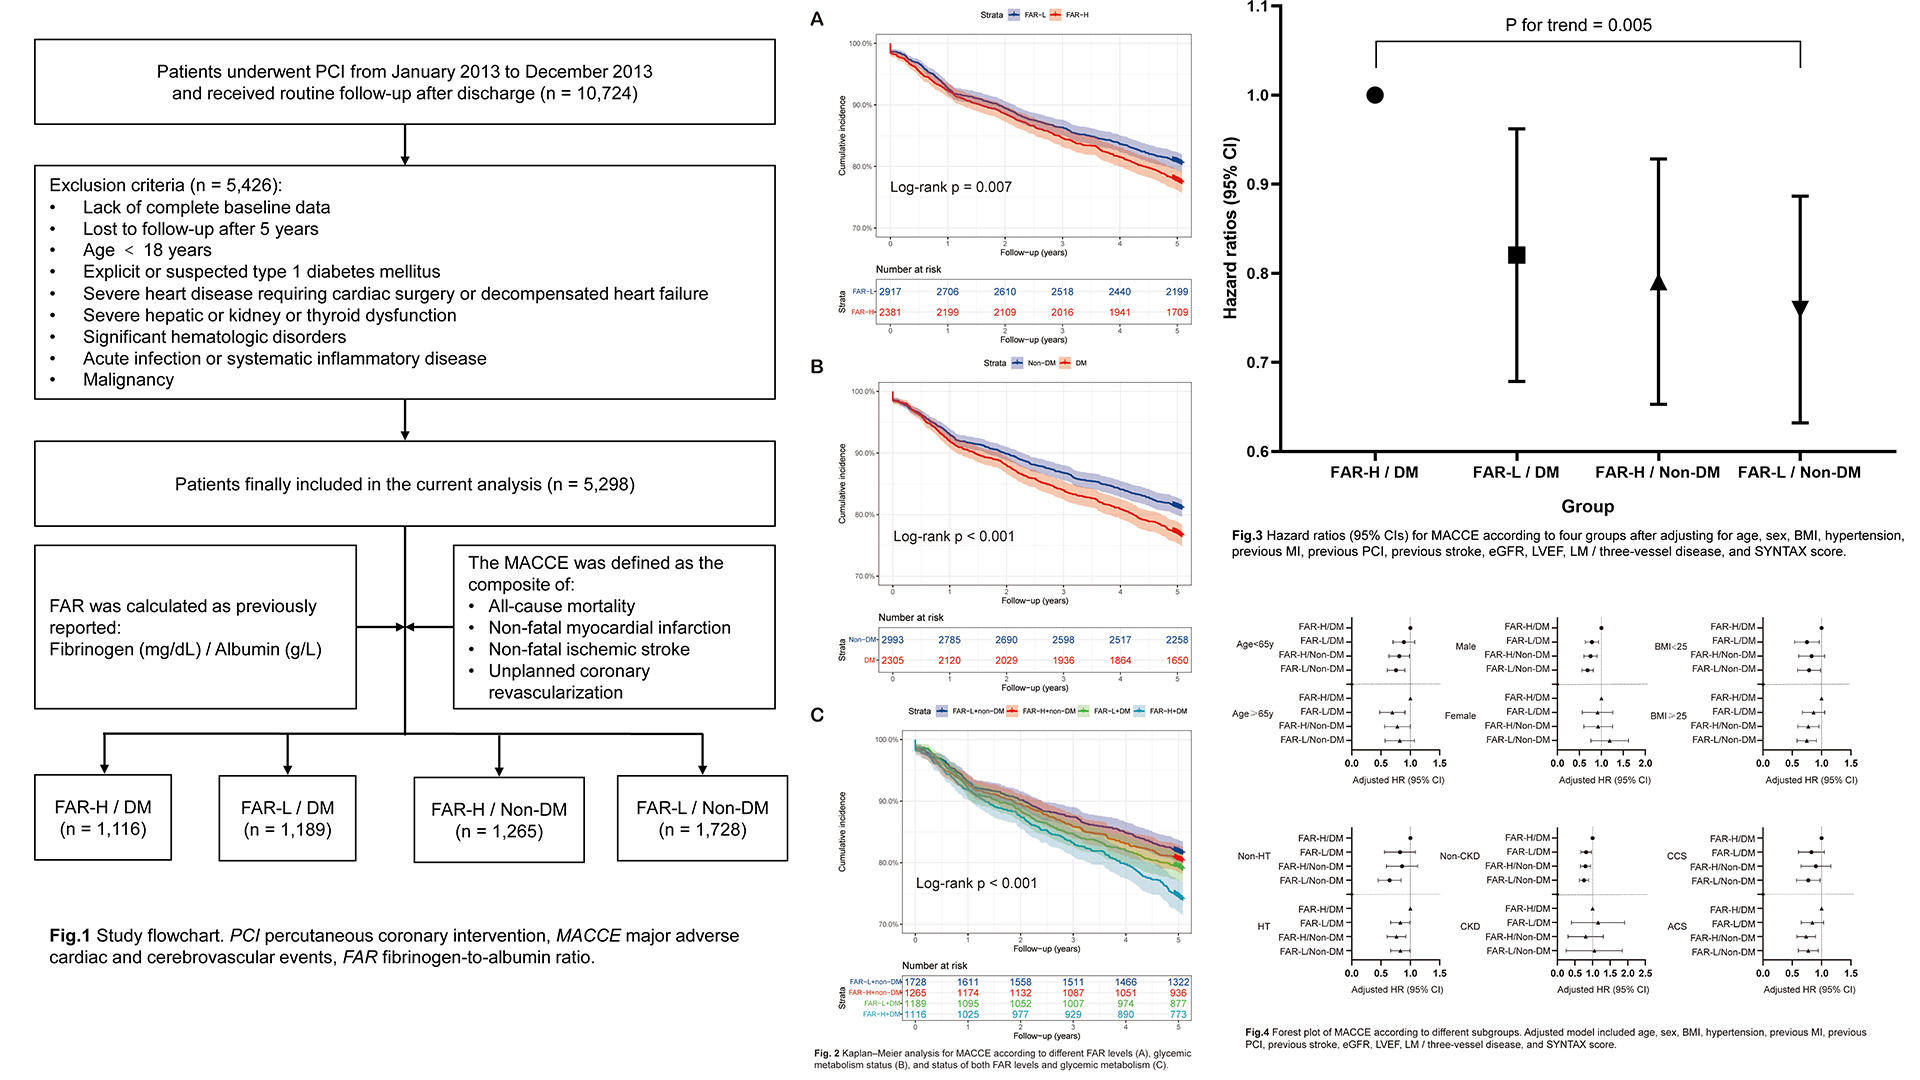
Inflammation plays a crucial role in coronary atherosclerosis progression, and growing evidence has demonstrated that the fibrinogen‑to‑albumin ratio index (FAR) is associated with the severity of coronary artery disease (CAD). However, the long-term risk of cardiovascular events remains indistinct in patients with different level of FAR and different glycemic metabolism status. This study was to access5-year clinical outcomes of diabetic and non-diabetic patients who underwent percutaneous coronary intervention (PCI) with different level of FAR.
Methods
We consecutively enrolled 10,724 patients with CAD hospitalized for PCI and followed up for major adverse cardiac and cerebrovascular events (MACCE) covering all-cause mortality, non-fatal myocardial infarction, non-fatal ischemic stroke and unplanned coronary revascularization. FAR was computed using the following formula: Fibrinogen(mg/dL) / Albumin (g/L). According to the optimal cut-off value of FAR, which was determined by the surv_cutpoint function of the R package survminer viaRStudio software (version 2021.09.0, http://www.rstudio.org), patients were divided into higher level of FAR (FAR-H) and lower level of (FAR-L) subgroups and were further categorized into for groups as FAR-H with DM and non-DM, andFAR-L with DM and non-DM.
Results
5,298 patients (58.36 ± 10.36 years, 77.7%male) were ultimately enrolled in the present study. A total of 1,099 (20.7%) MACCEswere documented during the 5-year follow-up. The optimal cut-off value of FARwas 0.0783 by the surv_cutpoint function. Compared to ones with FAR-H and DM,patients with FAR-L and non-DM, FAR-H and non-DM, FAR-L and DM had decreased risk of MACCEs [adjusted hazard ratio (HR): 0.75, 95% confidence interval (CI) 0.64-0.89,p = 0.001; HR: 0.006, 95% CI 0.66-0.93, p = 0.006; HR: 0.81, 95% CI 0.68-0.97,p = 0.019]. Notably, non-diabetic patients with lower level of FAR also had lower all-cause mortality risk than those in the FAR-H/DM group (HR: 0.41, 95%CI 0.27-0.63, p < 0.001). Multivariate Cox proportional hazards regression analysis also indicated the highest risk of MACCEs in patients with FAR-H andDM than others (p for trend = 0.005). In addition, subgroup analysis revealed consistent effects on 5-year MACCE across various subgroups.
Conclusion
Diabetic patients with higher level of FAR had the worse 5-year outcomes compared with patients in other three groups. The level of FAR may help to identify high-risk individuals in this specific population.